What kind of switches actually add value?
For a recent FiveThirtyEight article on possession value, I asked Matthias Kullowatz what he’d learned about soccer from building American Soccer Analysis’s goals added model. One weird thing, he said, was that although a play tends to be more valuable if it’s traveling upfield fast, it didn’t seem to matter much to the model how quickly the ball moves across the field. No matter what he tried, he couldn’t get a good signal from horizontal velocity.
I find that pretty surprising, too. Defenses almost always shift toward the side the ball is on, sometimes cramming all eleven players into one half of the field to trap play against the sideline. Shouldn’t a quick switch make it easier to find space and catch the defense out of position?
The Theory
“In all team sports, the secret is to overload one side of the pitch so that the opponent must tilt its own defence to cope. You overload on one side and draw them in so that they leave the other side weak,” Pep Guardiola told Martí Perarnau in Pep Confidential. The point of his team’s short passing, he explained, was to draw the defense in, switch play, and score with a “sucker punch” from the opposite side.
Drawing the defense to one side and switching play — “overload to isolate,” in au courant coach jargon — has always been part of soccer tactics. Back in the midcentury heyday of the W-M formation, according to Jonathan Wilson, “the ideal for attacking teams was to switch play rapidly from one flank to the other, ‘turning’ the defense and providing space for the winger so he could be traveling at speed by the time he reached the fullback.” When the 4-4-2 was in vogue, teams used wide wingers to stretch defenses with long switches and crosses. Michael Cox writes in The Mixer that Bayern Munich were so scared of Manchester United’s width in the 1999 Champions League final that they persuaded UEFA to narrow the Camp Nou pitch by four yards.
These days, though, long switches seem to be a matter of taste. Last season Sevilla, Real Madrid, Liverpool, and Bayern Munich stood out for how often they switched play, but lowly Eibar and Strasbourg were right up there with them. Barcelona and Paris Saint-Germain ranked near the bottom of Europe in switches per game despite playing more passes than just about anyone. In general, good teams tend to play slightly fewer switches per hundred pass attempts, but the relationship is too weak to draw sweeping tactical conclusions. If switching play is the secret to team sports, it’s tough to see it in the aggregate stats.
Still, you’ve got to figure some kinds of switches are better than others, right? For last year’s Big Book of Buildups, I spent a lot of time watching how Champions League teams played against each other and decided that flatter switches looked more promising than long diagonals:
Switching to the diagonal option feels aggressive but ends with a turnover or backpass. Switching to the lateral option feels too safe but ends with a dangerous two-on-one where the ballcarrier is running into space at a fullback who’s pinned, unable to step to him without risking a throughball that would put the winger in on goal.
In clips I cut from around 700 minutes of 15 group stage games, I couldn’t help but notice that "half of the diagonal switches led to turnovers and none led to a shot, while none of the lateral switches led to turnovers and half of them led to shots." Outcome-wise, it seemed clear that flatter switches were better.
Back then I didn't really have a way to dig into it further, but while I was thinking about Matthias's horizontal velocity problem it struck me that some of the tricks I'd learned to look at data on goal kicks and throughballs might be useful here. Forget 15 games. What kinds of switches were most valuable across seven Premier League seasons?
The Data
The first step was to cluster 43,000 switches into a dozen common types based on their origin, distance, and angle. (For our purposes, a switch is any pass that travels at least half the width of the pitch and doesn't start or end in either box.) One quick and easy way to figure out which types are best would have been to use a possession value model, but I didn’t have one handy. What I did have was expected goals for actual shots. If a switch’s reward is the probability that it will produce a goal for the attacking team and its risk is the chance of a goal for the defending team on the next possession — what I’ll call “xGD2,” or expected goal difference across two possessions — then it’s true that lateral switches are historically better:
Not only are shorter, flatter switches much more likely to reach a teammate, but they have better average xGD2 than long diagonals even when you look at completed passes only. It’s not obvious to me why that’s true. Maybe a long diagonal that’s marked complete in the data tends to lead to an incomplete header or loose touch as the receiver tries to bring it down, or maybe he controls the ball but finds a fullback closing him down and no teammates nearby to support him. It could also be easier for a defense to counterattack against a team that uses diagonals to stretch the field. As Juanma Lillo likes to say, “The faster the ball goes, the faster it comes back.”
Anyway, xGD2 doesn’t give us the full picture of a switch’s value. Along with the risk and reward of an attempted pass type, we should also look at its opportunity cost — the goal probabilities of all the other things a player might have done with the ball instead. The yellow sideways switch in the top right corner of the plot above may have the best average outcome of the six types shown, but it also has the highest opportunity cost, since it starts from the attacking halfspace. There’s a lot of dangerous stuff you can do from that part of the field. You can dribble into shooting range. You can zip a pass up the channel to set up a cutback. Maybe knocking it over to the opposite wing isn’t the best use of the ball in that situation.
To get a baseline estimate of opportunity cost, I took the average xGD2 of any pass, dribble, carry, or shot from each switch type’s zone of origin during the part of a possession most likely to produce a switch. Sure enough, the average xGD2 of our short, flat, halfspace-to-wing switch was almost exactly equal to the baseline value of all the other things the passer could have done from there. The switch with the best average outcome turns out to be, on average, just a break-even play.
When you do the math like that, our twelve types of switches come out in this order:
Now we start to get a better picture of our switches’ value. Long diagonals, on the bottom row, are still a net negative. Flat sideways switches, in the middle row, are neutral. The passes most likely to actually improve a team’s situation are on the top: a switch that’s not too steep, not too flat, but angled slightly forward is just right.
Before we keep going, it’s worth pointing out that all of the action values here are pretty close to zero. For our most valuable switch, that fullback-to-opposite-center-back pass that Kyle Walker loves, you’d have to do it five times a game for 50 games just to produce one expected goal’s worth of difference. The tiny values also mean that if you used a possession value model to get better baselines and controlled for team strength effects, you might add a thousandth of a goal here, subtract two thousandths there, and wind up with a different ranking (maybe diagonals are good!).
But let’s set all that aside and take the findings at face value: switches angled slightly forward are generally a good idea. Why is that?
The Video
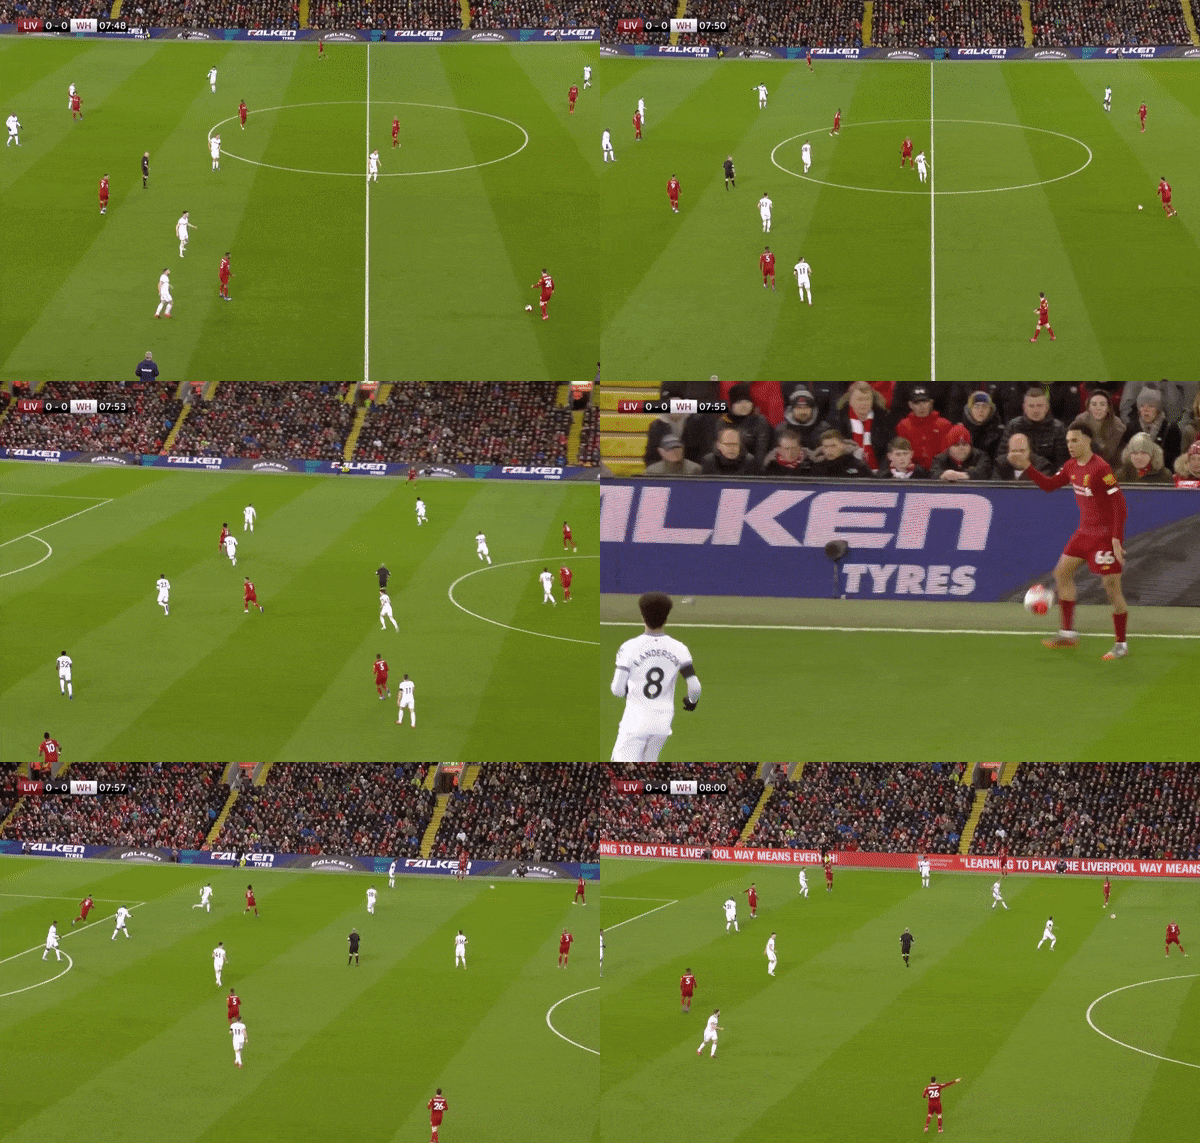
At this point I went back to the tape, pulling clips of three switch types that start successively higher in the halfspace and end in the same area of the wing: Cluster 3 (the long Virgil Van Dijk diagonal), Cluster 8 (the slightly forward Granit Xhaka switch), and Cluster 9 (the Eden Hazard sideways special).
The switches in Cluster 3 have the worst average value of the three types. Van Dijk, despite being a very good passer on a good team, has attempted 105 of them in his Premier League career for a cumulative xGD2 of basically zero. Even when these diagonals come off, the results usually aren’t as spectacular as you might imagine:

A slightly better pass here might have dropped in front of Alexander-Arnold and caused more danger, but if Van Dijk can’t land a better pass, who can? Sixty yard switches are hard, man. Even though Alexander-Arnold has room to field the ball on the hop, the defense — which hadn’t shifted over that far to begin with against a center back deep in the halfspace — has plenty of time to get over and cut him off.
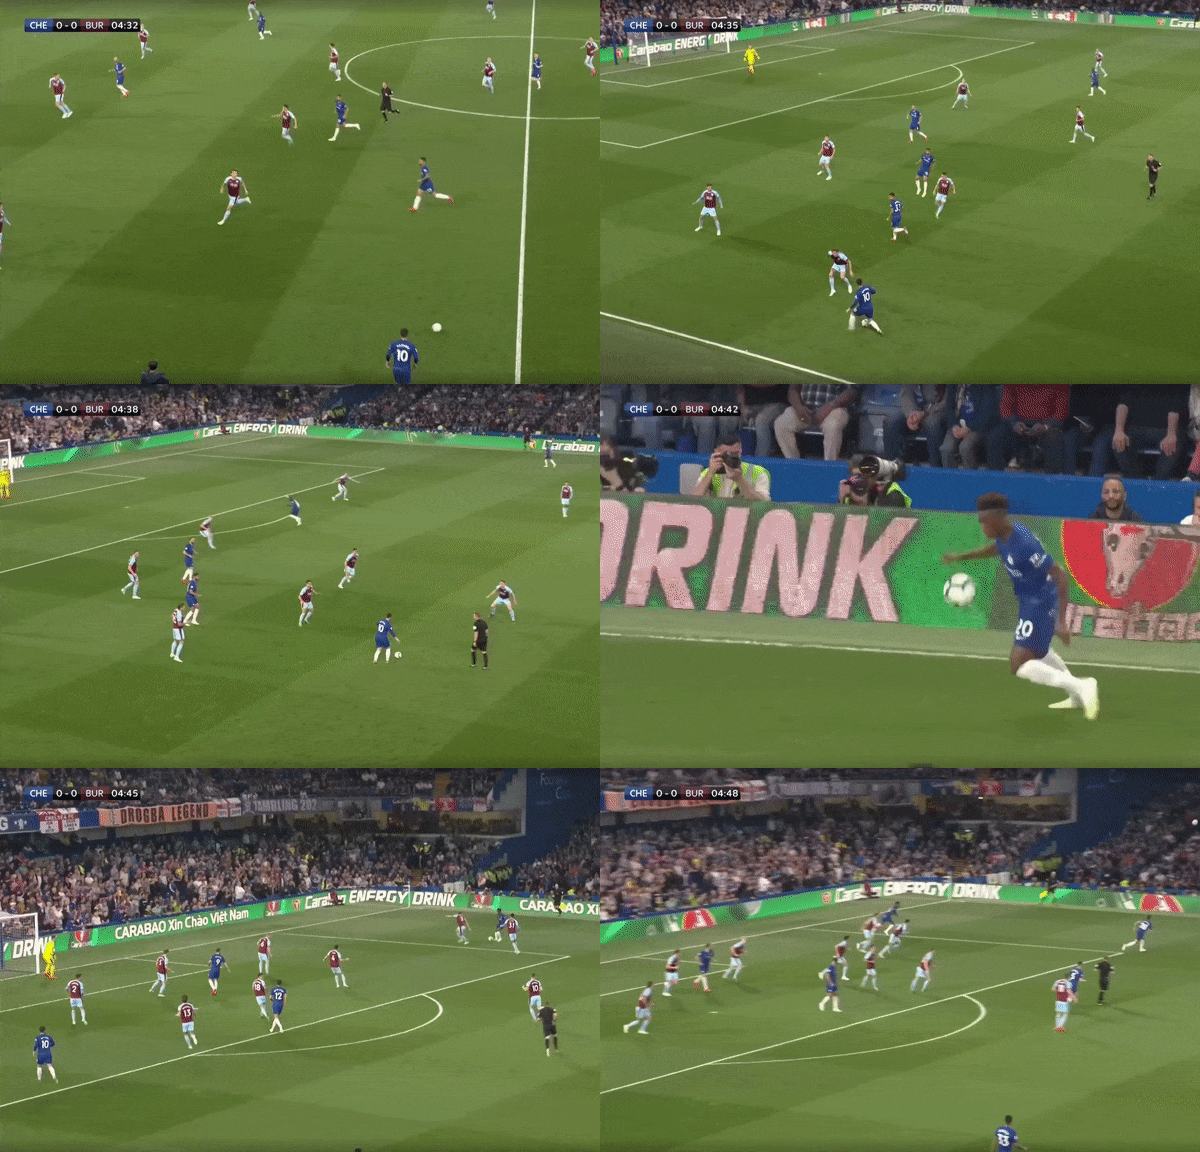
Cluster 9 is that flat switch we talked about earlier with the super high xGD2 that turns out to be a break-even proposition when you account for opportunity cost. Take this Hazard pass, for example:

There’s nothing really wrong with the flat switch to Callum Hudson-Odoi, who’s in plenty of space to receive and dribble at the fullback on the opposite side, but is that really more likely to help Chelsea than if Hazard had tried to pick out N’golo Kanté’s run in the box? By the time you’re in the attacking halfspace, a switch may not be your highest expected value option.
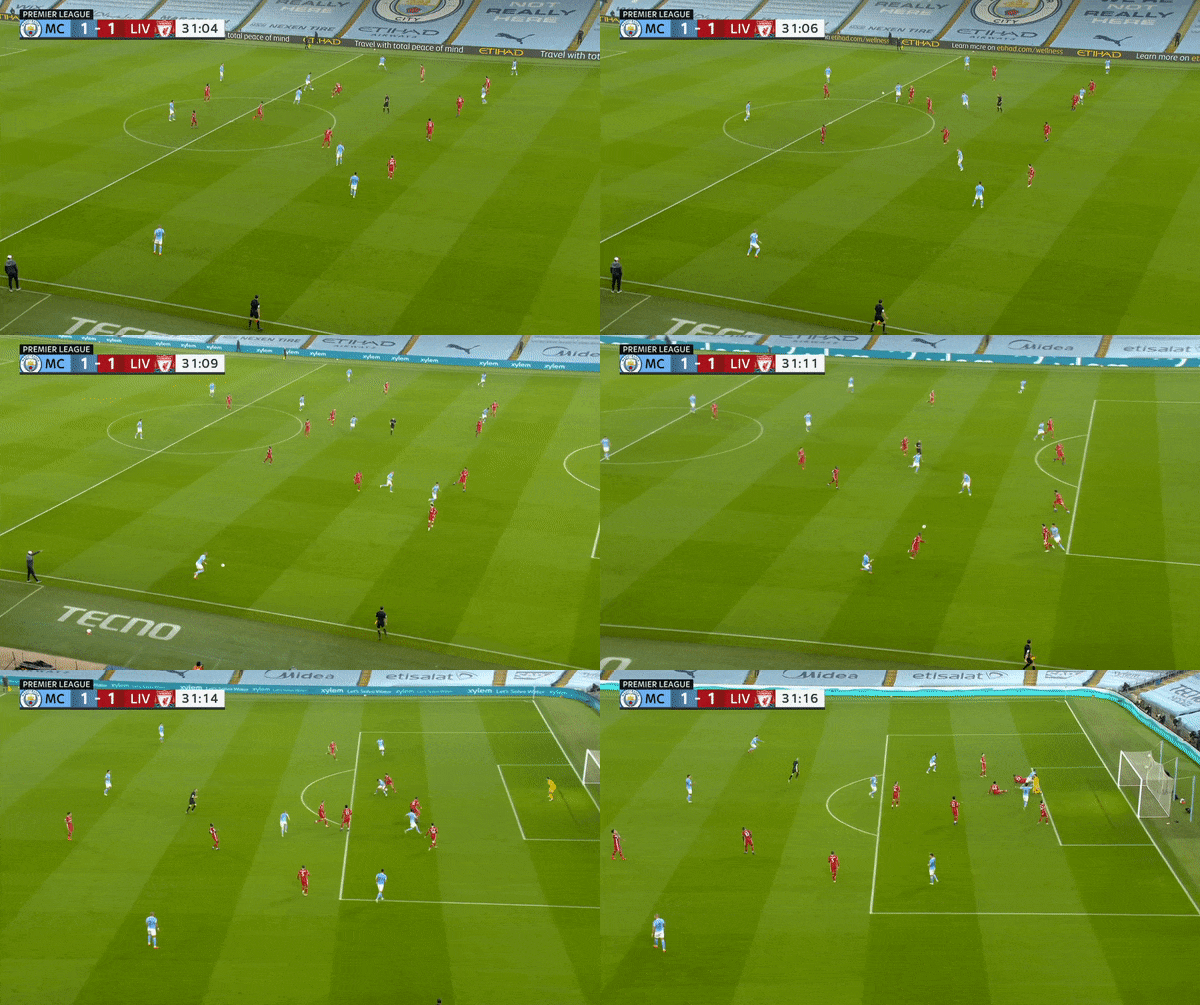
Compare that to this Rodri switch from the most valuable of our three types, Cluster 8:

Right before this clip, City has exchanged some short passes on the left side, dragging the defense over to close up spaces. This limits Rodri’s options to play forward and lowers the opportunity cost of a switch. Circulation to City’s center backs would be Liverpool’s cue to start moving back to the middle, but as long as the ball stays with Rodri on the second line, the defense stays compact. Andrew Robertson, Liverpool’s left back, is almost in the center of the field, leaving Kyle Walker completely unmarked on the wing.
This isn’t a mistake from Liverpool. It’s how most teams would defend in this situation, which I think is why so many of the most successful switches in this type involve a defensive midfielder finding an open fullback on the wing. The attacking team’s winger will typically tuck inside or make a run into the box, dragging the opposing fullback with him. That leaves room for the guy who receives the switch to control the ball, carry forward, and pick out a target around the box while the defense is still getting back in position.

The Conclusion
What struck me while watching a bunch of switches was how similar some of the types look. Sure, some are from center backs and some from midfielders, some to fullbacks and some to wingers, but they feel like they’re accomplishing more or less the same thing. They’re not. What the data brought home for me is what a dramatic difference it can make for a similar-looking pass to be delivered at a slightly different angle from a spot 10 or 15 yards farther upfield: different completion rates, different outcomes, different opportunity costs. Good coaches will harp on how much a few yards here or there matters, and you can see why they’re right.
From another point of view, though, the differences aren’t really dramatic at all. The average action values are so close to zero that whether your team attempts good switches or bad ones probably won’t matter that much even over the course of a season. Maybe the real finding here is that what Matthias was seeing is right: moving the ball quickly across the field just doesn’t make that much difference on average.
But soccer isn’t played by averages but by people, and the last thing this left me thinking about is how little the general principles of play you might take away from an exercise like this matter compared to who’s on the field. If you’ve got the actual Trent Alexander-Arnold attempting switches in his favorite Cluster 2 and completing them at his career 72% rate instead of the average 58%, to the feet of Andrew Robertson or Sadio Mané instead of an average Premier League player, the expected value of those passes is going to be a lot higher than the average 0.002 goals (Alexander-Arnold’s career rate is 0.013). If you’re Real Madrid and you’ve got Toni Kroos, you can build a whole game model around switches and be a good team.
Data matters. Tactics matter. All the little details of a game model matter. But the secret to team sports isn’t overloading one side and then switching play — it’s the players. ❧
Image: Michael James, Bouree Quilt
Sign up for space space space
The full archive is now free for all members.