Meet the People Who Explained Soccer in 2020
• 12 min read
Welp, we made it. I don’t need to tell you all the reasons 2020 sucked, but if you can look past the whole world falling apart thing for a minute we can focus on what really matters, which is that it was a pretty great year for soccer analysis. To celebrate, I reached out to the people behind twelve of my favorite big soccer projects this year (twelve because this was originally going to be one for each month until I realized that was dumb and I’m not sure January and February even happened). I asked them how they got interested in their thing, what they learned from it, and what we have to look forward to in the coming year.
Before we get started, I should probably disclose that I’m friendly with a lot of these people online and was tangentially involved in a couple of these projects, which is evidence either that I’m a hopeless shill or that the soccer analysis community is great for getting to know people who share your interests (probably both). Anyway, you can follow them and a bunch of other analyst types on a Twitter list here.
For almost as long as soccer stats have been a thing, they’ve been pretty much synonymous with WhoScored, which started publishing tables full of Opta numbers for leagues around the world in 2008. That changed in April when FBRef, the soccer arm of the Sports Reference sites every stathead has bookmarked, partnered with Statsbomb to help catch public stats up with the times. The new and improved FBRef tables have reliable xG and all kinds of other on-ball metrics for some of the world’s most popular leagues, along with a few features like defensive pressures that are only available in Statsbomb data.
The smorgasbord of fresh numbers kept Twitter busy during quarantine, and FBRef’s founder, Sean Forman, says there’s more to come in 2021. “We’re going to add many new features that try to give you an idea how players and teams play. Their role and their quality relative to league,” Forman told me. “Next month we’ll have some dashboards showing players relative to their peers in various important stats.” In the meantime, dig around the site’s old-school links for underexplored pages like the national team scouting tables that track how a country’s players are doing with their clubs.
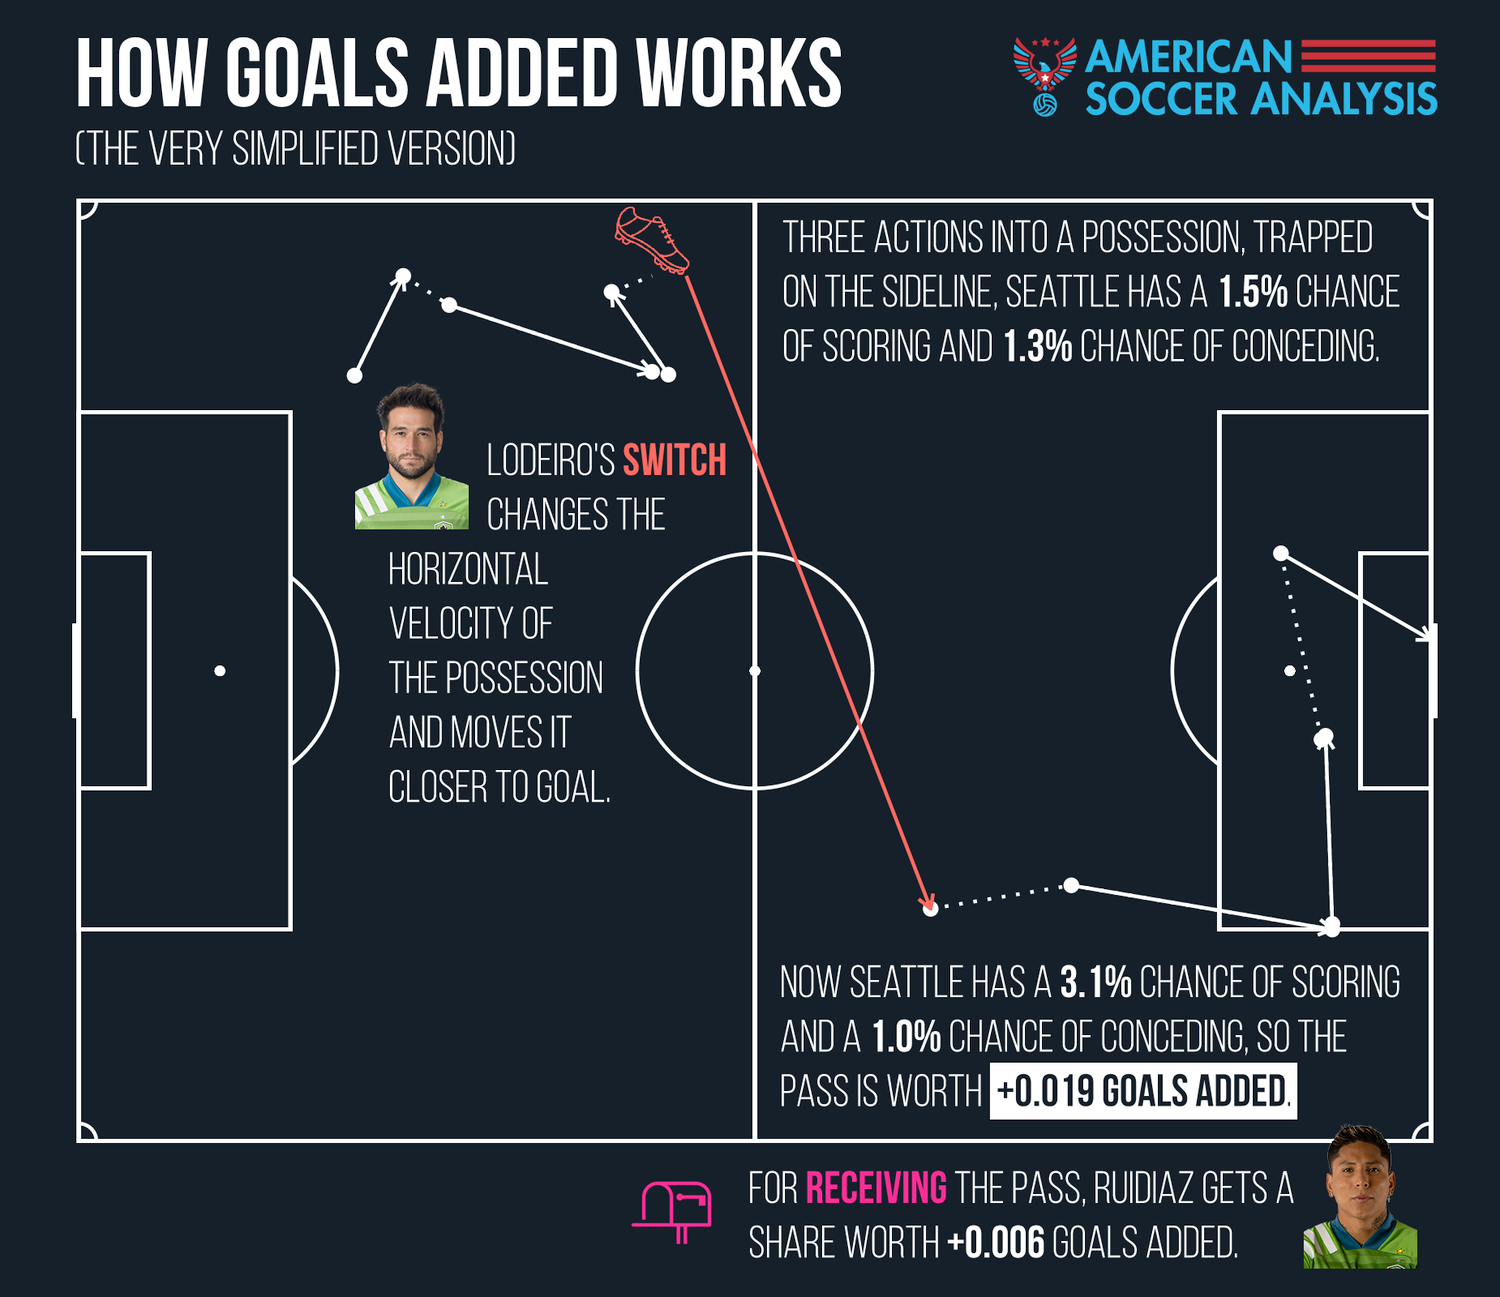
Speaking of sites with great stat tables, American Soccer Analysis went way beyond xG this year when it rolled out a possession value metric called goals added (g+) for MLS and NWSL. “Ever since we founded American Soccer Analysis in 2013, I’ve hoped to construct a metric that credits players for actions all over the field,” Matthias Kullowatz wrote in a methodology article that explains how his new model does just that by estimating how much every touch changes a team’s chances of scoring and conceding. The model gives a better picture of a player’s total on-ball contribution by measuring passes, tackles, headers and everything else using a common currency: goals. And by looking at more than just shots, it also does a better job than xG at predicting teams’ future performance.
But that’s just scratching the surface of possession value’s potential as an analytical tool. I asked Kullowatz what he hoped to do with g+ next year. “Build a player projection model, build a long term player value simulator from that, derive a team projection model from player components,” he said, before continuing to rattle off a laundry list that should keep ASA busy for a while. For the last few months ASA Slack has been talking about how to use g+ to measure player defense, which your usual counting stats like tackles and interceptions are notoriously bad at.
And then there are the goals added spinoffs by ASA contributors. Tiotal Football’s been putting his background in finance and accounting to work in a newsletter called Absolute Unit, about how sporting directors, scouts, and data analysts can speak the same language by thinking of players’ contributions in terms of goal difference. Although g+ isn’t available for Europe, Mike Imburgio and Sam Goldberg built a model to estimate it using players’ FBRef numbers, then mixed in age and playstyle to cook up a metric called DAVIES that could help “a team with a small data budget recruit from leagues they don’t have event data from,” Goldberg said.
Goals added wasn’t the first event data-based possession value model, an idea the late Garry Gelade reminded us “goes back at least 9 years to Sarah Rudd's Markov model.” A team at the Belgian university KU Leuven rolled out a similar model called VAEP last year via journal articles and the socceraction Python package. In February they published a paper comparing VAEP to Karun Singh’s expected threat metric. “I quite like this work as I think it may be the only empirical comparison of two different EPV frameworks,” said Jesse Davis, the professor supervising the university’s gang of soccer-curious grad students.
One of those students was Tom Decroos, whose 194-page dissertation, published in September, includes a lot of the team’s recent work. “I think my publications definitely illustrate the current limitations of event stream data,” Decroos told me. He’s holding out hope for broadcast tracking data to help get us beyond on-ball events, where field position is by far the most important information. As for the current KU Leuven team, Davis says they’ve been working on “new techniques that will allow us to have a much better understanding of the black box models we’ve used for xG and VAEP.” (I wrote about some of that research in this week’s paid newsletter about how to watch Di Stéfano’s Real Madrid like a PV model.)
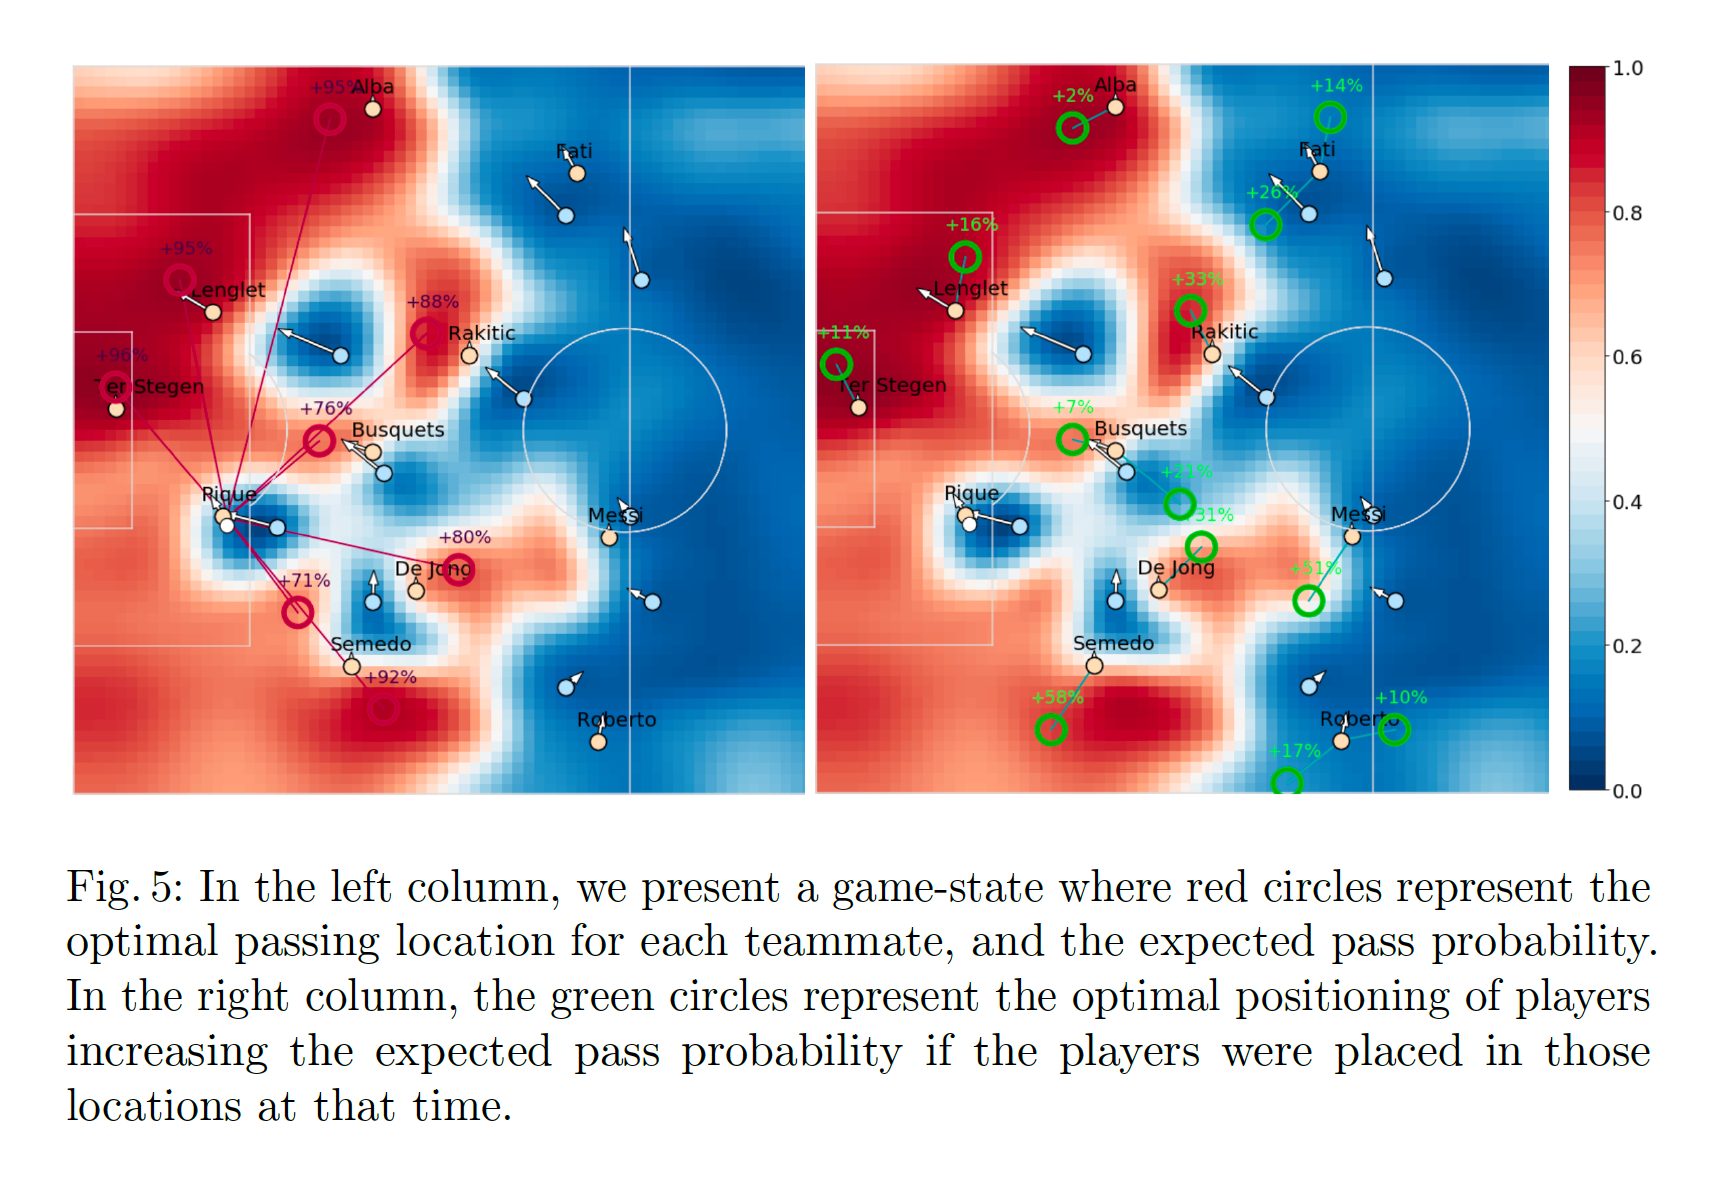
If you like your soccer as academic as possible, the gold standard in public data analytics is the years-long collaboration between FC Barcelona’s Javier Fernández and the Sacramento Kings’ Luke Bornn, whose latest project aims to “develop a fine-grained analysis of players' positioning and decision-making.” I’d be lying if I pretended to have any idea what a “fully convolutional neural network” is, but the paper’s applications—including calculating where teammates should be positioned off the ball to give a passer the best options—look like exciting progress toward studying the game’s hardest questions. Now if only they can get Ronald Koeman to listen.
Good thing we’ve got folks like Toronto FC analyst Devin Pleuler to help aspiring soccer analysts work their way up to Fernández and Bornn’s level. “I believe that people who have managed to wiggle themselves into dream jobs have a responsibility to help others reach there too,” Pleuler wrote in April when he published a handbook to teach people how to work with soccer data in Python and build models ranging from simple linear regression to an event-data version of those pass probability neural networks (there they are again). But he also had an ulterior motive: “Selfishly, I steal stuff from the analytics community all of the time. And if they have better tools, it might procure better stuff,” Pleuler told me. If you want to help out, you can start by contributing code to the handbook’s utilities section.
If the KU Leuven team published a textbook’s worth of peer-reviewed reading material and Pleuler handed out the worksheets, David Sumpter’s Friends of Tracking videos provide all the lectures you’ll need to complete your informal degree in soccer analytics. Launched in the early days of quarantine with a 92-minute Zoom conversation titled “How to become a football data scientist,” the YouTube series has grown to dozens of educational talks with some of the world’s best soccer analysts, including Barcelona’s Fernández and Liverpool’s William Spearman. The result has been an uptick in new public work as the analytics community took an interest in concepts like pitch control and possession value.
“I think Friends of Tracking contributed in three ways,” said Jan Van Haaren, a KU Leuven alum who’s now Chief Analytics Officer at SciSports. It gave the community easier access to data (including some of the first public tracking data), code examples, and “increased understanding of the needs of practitioners within clubs.” It’s all part of an effort to help bridge the divide between different analytics communities. Although some methods academics have published in recent years are “very powerful,” Van Haaren said, “they are barely used by clubs because the clubs lack the expertise to put these methods in production.”
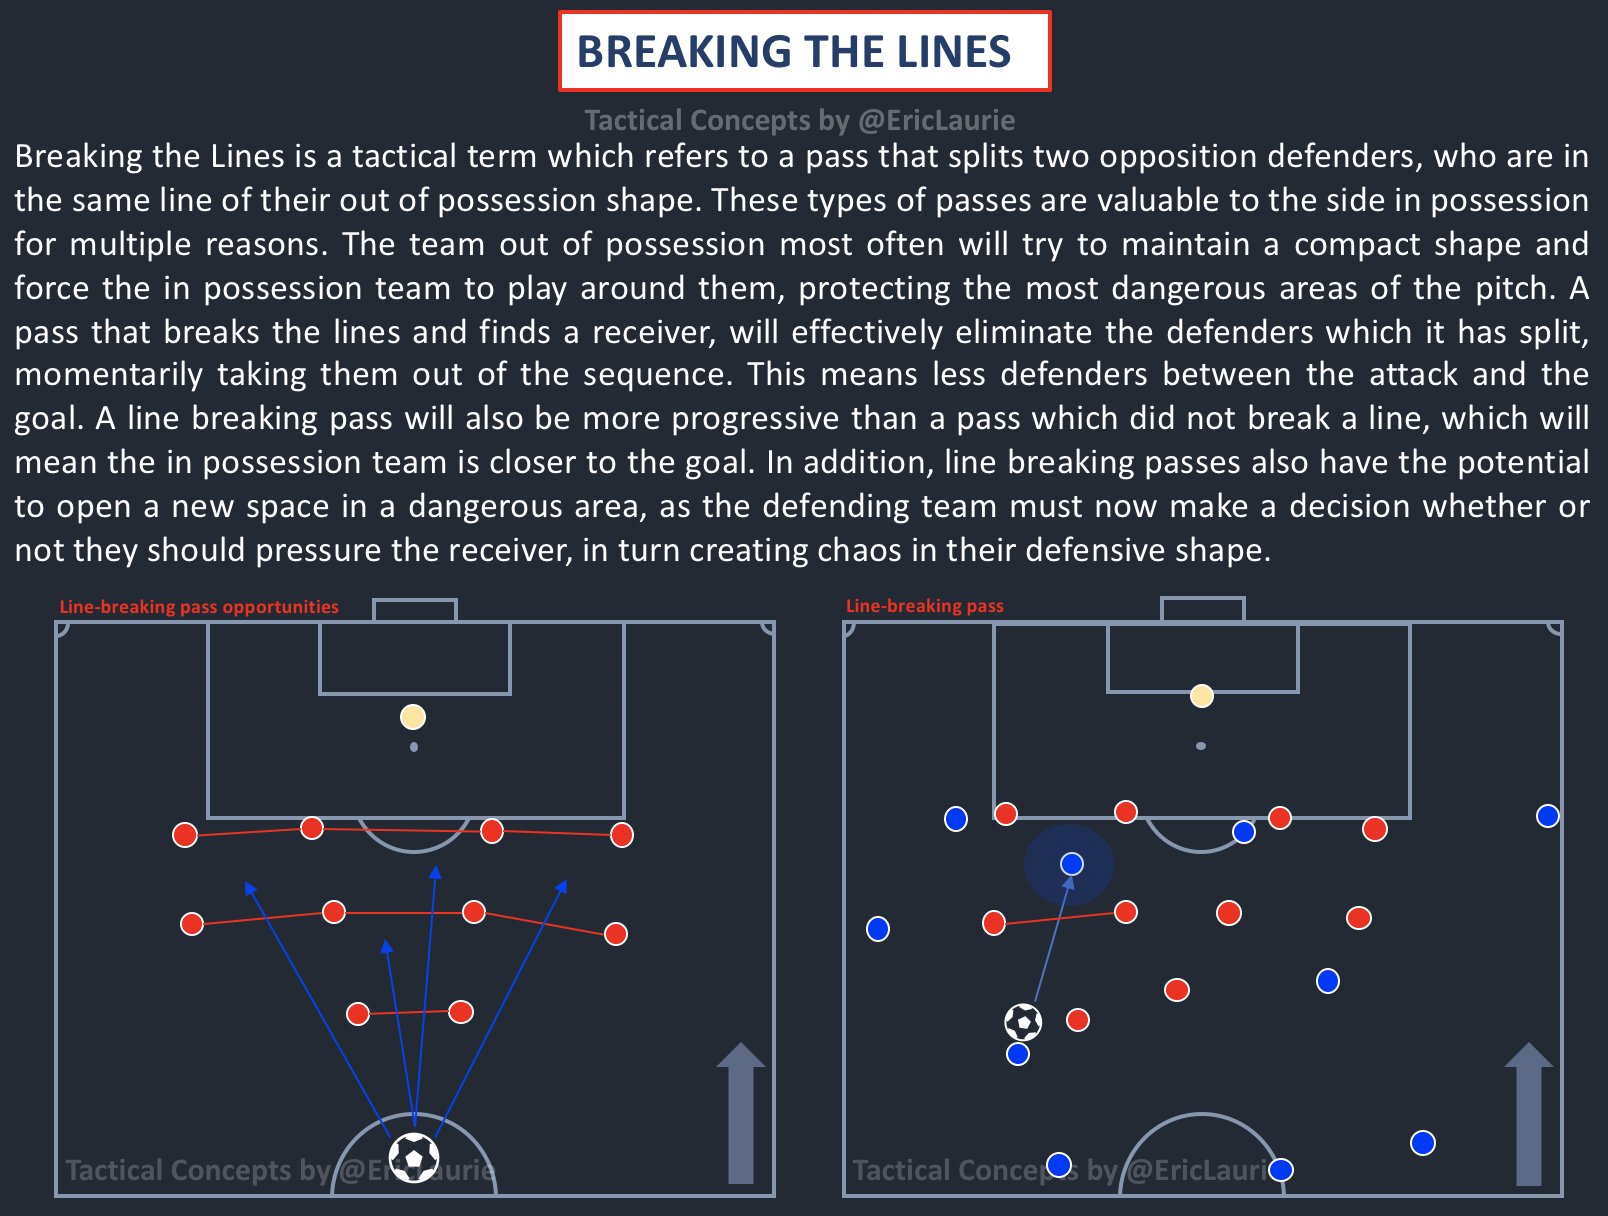
Don’t worry, soccer analysis wasn’t all code camp this year. Molde FK analyst and academy coach Eric Laurie took us back to basics with a series of illustrated tweets that explained common tactics terms as clearly as you’ll find anywhere. “I’ve quite recently started using Twitter to share some of my tactical analysis with the football community,” Laurie said. “I figured providing the definitions of these terms, the way I see them, would not only benefit the community but also help me to refresh and reinforce my understanding of each concept.” The enthusiastic response showed how hungry fans are to understand how coaches see and talk about the game, so it’ll come as welcome news that Laurie’s thinking about how to turn the series into a bigger project in 2021.
Former University of Virginia and U.S. Soccer analyst Carlon Carpenter took a different approach to illustrating tactics fundamentals on social media, pumping out near-daily videos that he annotated with Metrica Sports’ software. “Twitter is great for bite-sized clips, so instead of doing full-length longform stuff, I tried to do small concepts,” he told me. The clips started good conversations with coaches and gave him practice at trying to illustrate things in a way players would easily get the hang of. They also helped land Carpenter a job with Statsbomb as a tactical and video analyst, where he’s working on projects to “link the video and data side of things together.” But what really made Carpenter’s series great was that he shared the whole archive—over a hundred videos—on Google Drive to keep coaches in need of visual aids or curious students of the game busy for hours.
Hello everyone! A month or so ago, I opened up access to my Google Drive folder with all my publicly available videos in it. Due to how many people appreciated it, I've opened it up again for the foreseeable future.
— Carlon Carpenter (@C_Carpenter14) November 30, 2020
👇🏼👇🏼👇🏼https://t.co/mH9BKFnG6g
Once upon a time, there was supposed to be some kind of Montagues and Capulets blood feud between tactics people and analytics people, which never really made much sense. But, soft! what light through yonder window breaks? It is The Athletic, where former Opta data analyst Tom Worville routinely teams up with writers from other schools of soccer coverage, including the tactics writer Michael Cox.
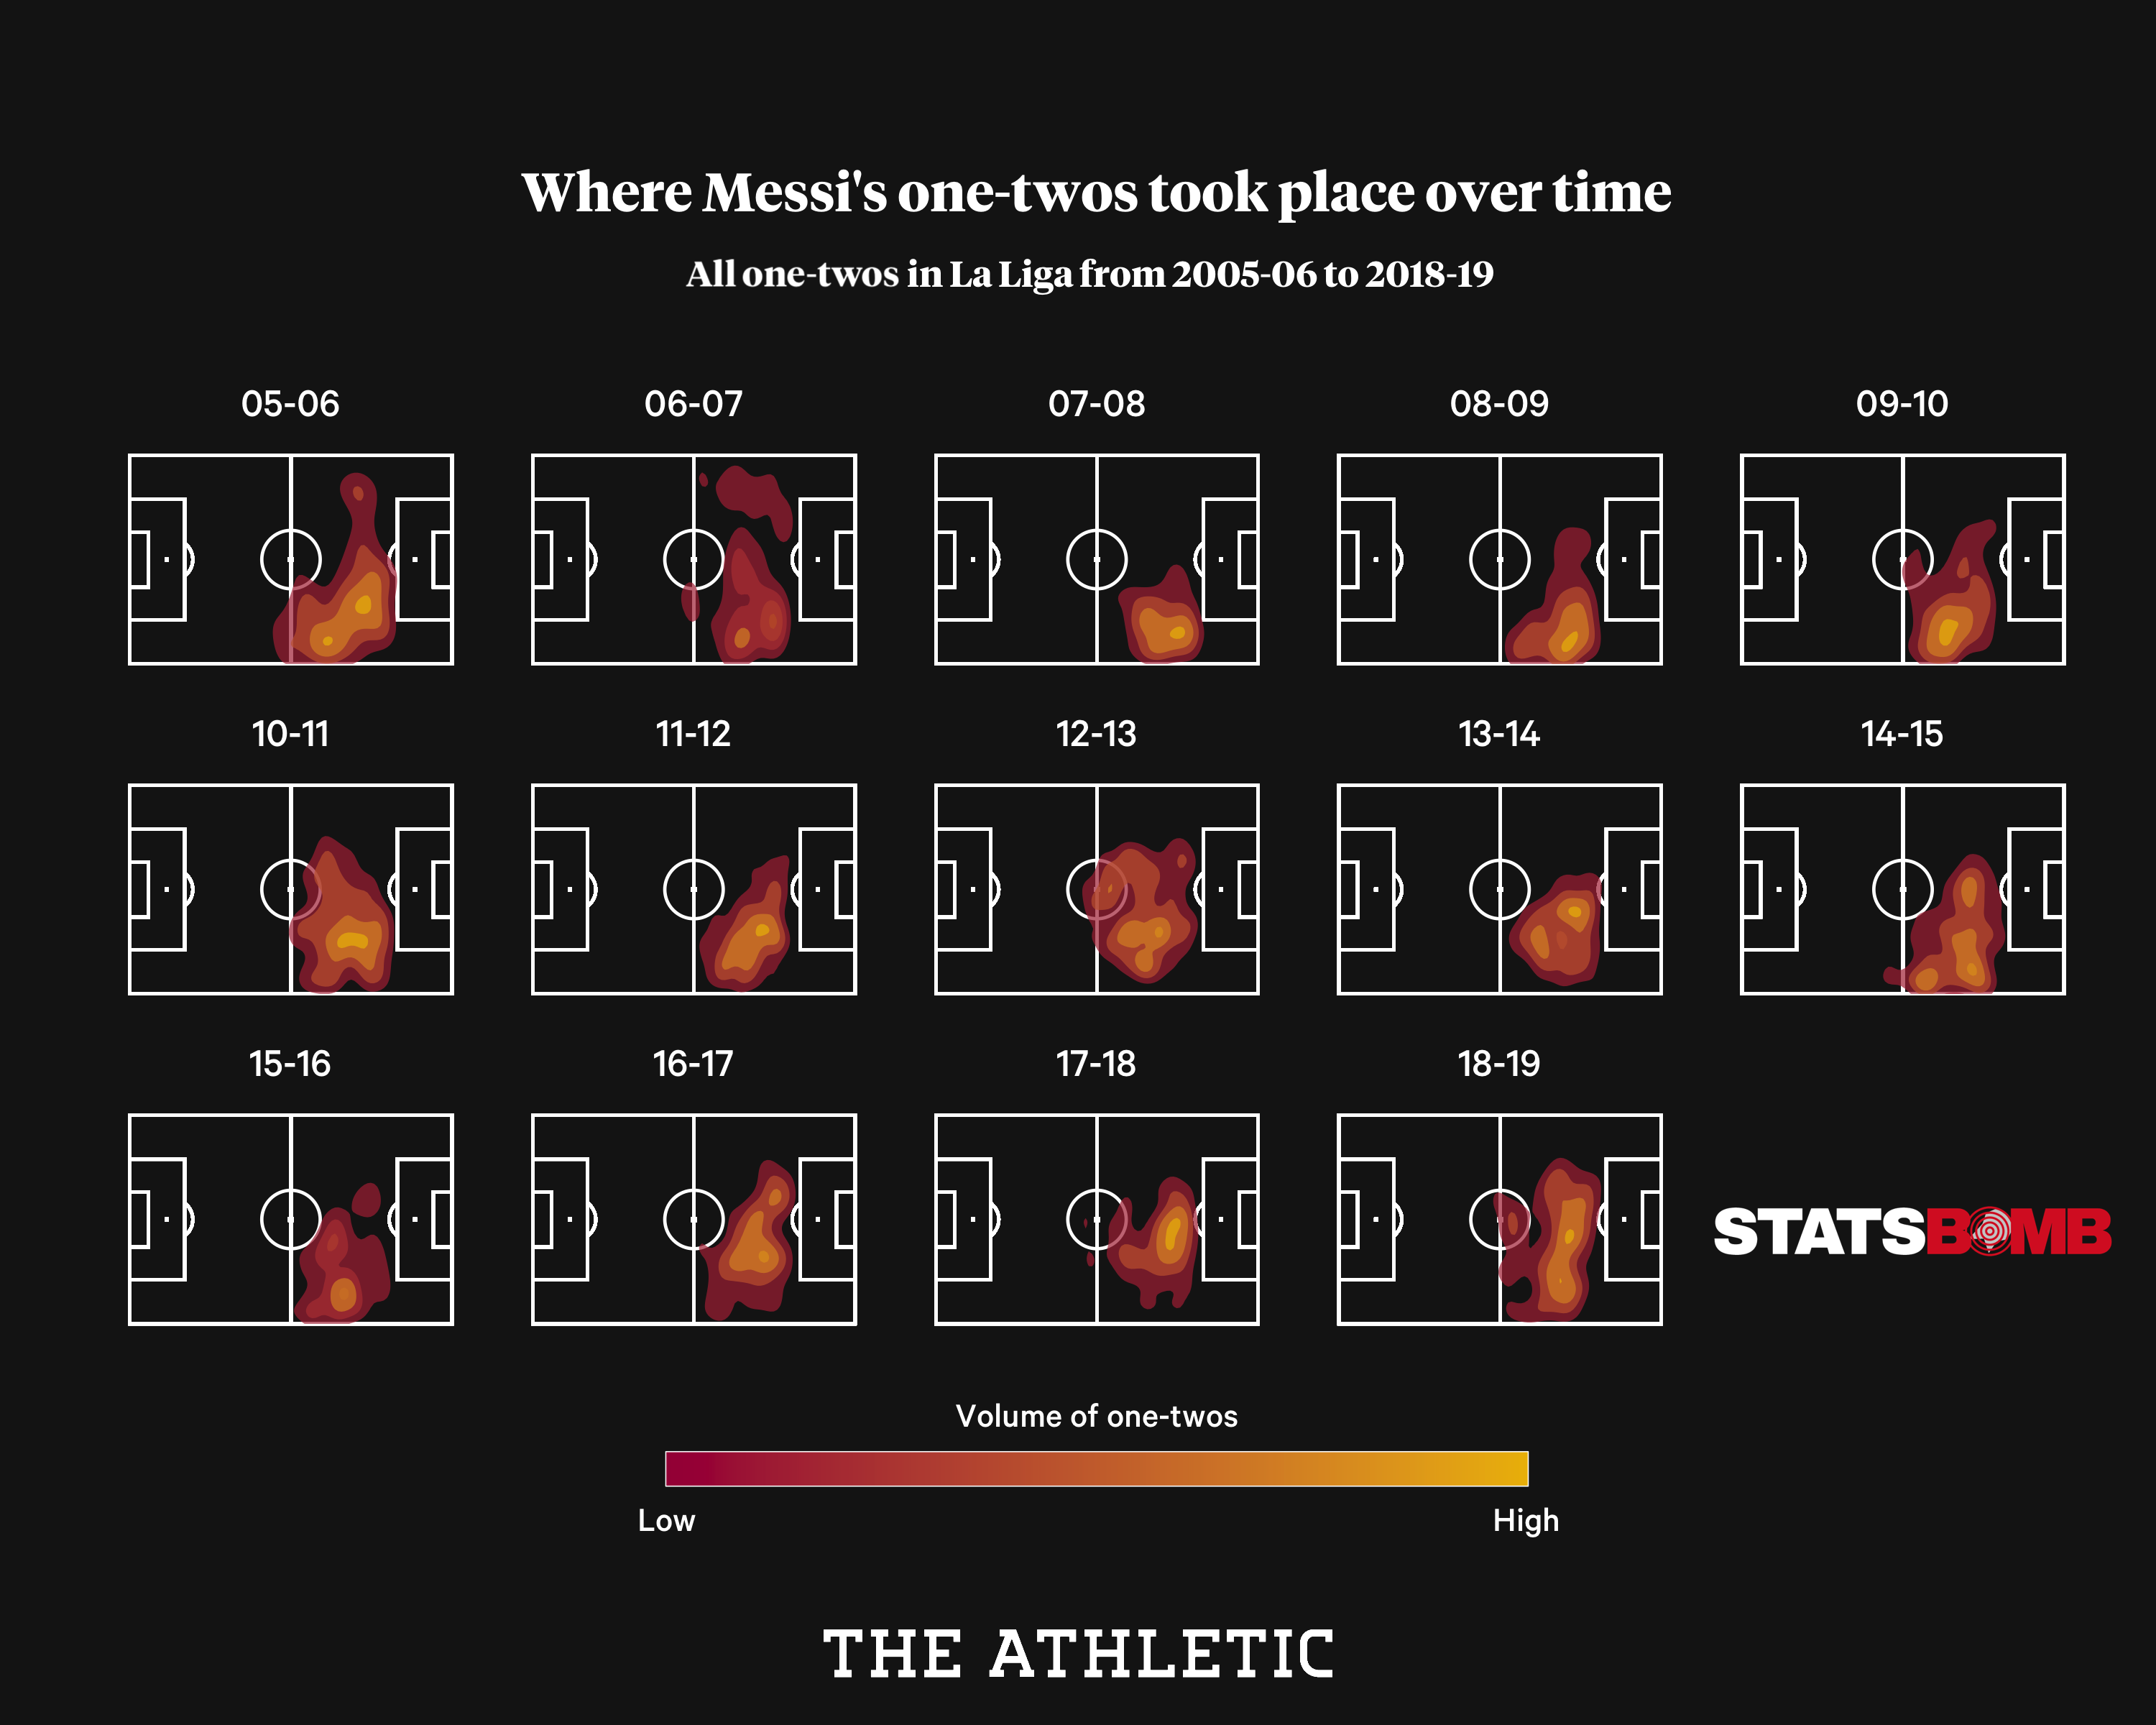
It’s been a happy marriage. “I think with Coxy his main strength lies is his impeccable powers of observation. He can watch a game and find the interesting tactical slant,” Worville said. “Ha, he’s never that nice about me in person,” Cox told me. “I think he’s great at making in-depth stats make sense to people who don’t necessarily love stats,” he said of Worville, who he credits with introducing him to some new tools. In their biggest project together, an excellent deep dive on how Lionel Messi’s game has evolved over the years, Worville used public Statsbomb event data to highlight where (and with which teammates) Messi played his beloved one-twos. “I didn’t know that was possible,” Cox said.
This year’s best longform player analysis wasn’t limited to Athletic stories on the reigning GOAT. When the pandemic knocked soccer off TV for a few months, fans turned to old Footballia footage instead. “Michael Caley sparked a discussion on players from different eras who’d be better regarded if we had event data from back then,” the former Statsbomb writer Mohamed Mohamed told me. When people started arguing about whether Zinedine Zidane was overrated, Mohamed decided to see for himself. Modeling his film study after Ben Taylor’s Thinking Basketball, he analyzed Zidane’s skillset by watching 30 full matches across five years of his prime and decided that yeah, actually, maybe he was a little overrated—or at least the picture was more complicated than you’d see on YouTube.
Readers loved the detailed firsthand examination of Zidane, so Mohamed did nine more profiles of former greats for a series he called Football Flashbacks. “I would say that I came to value off-ball movement from attackers so much more,” he said when I asked him what he learned from spending months of quarantine drowning in old soccer games. “Original Ronaldo was such a freak because he was a genuine dual on/off-ball threat. I now try harder to look for more granular details like body shifts that players use to set up off-ball runs.”
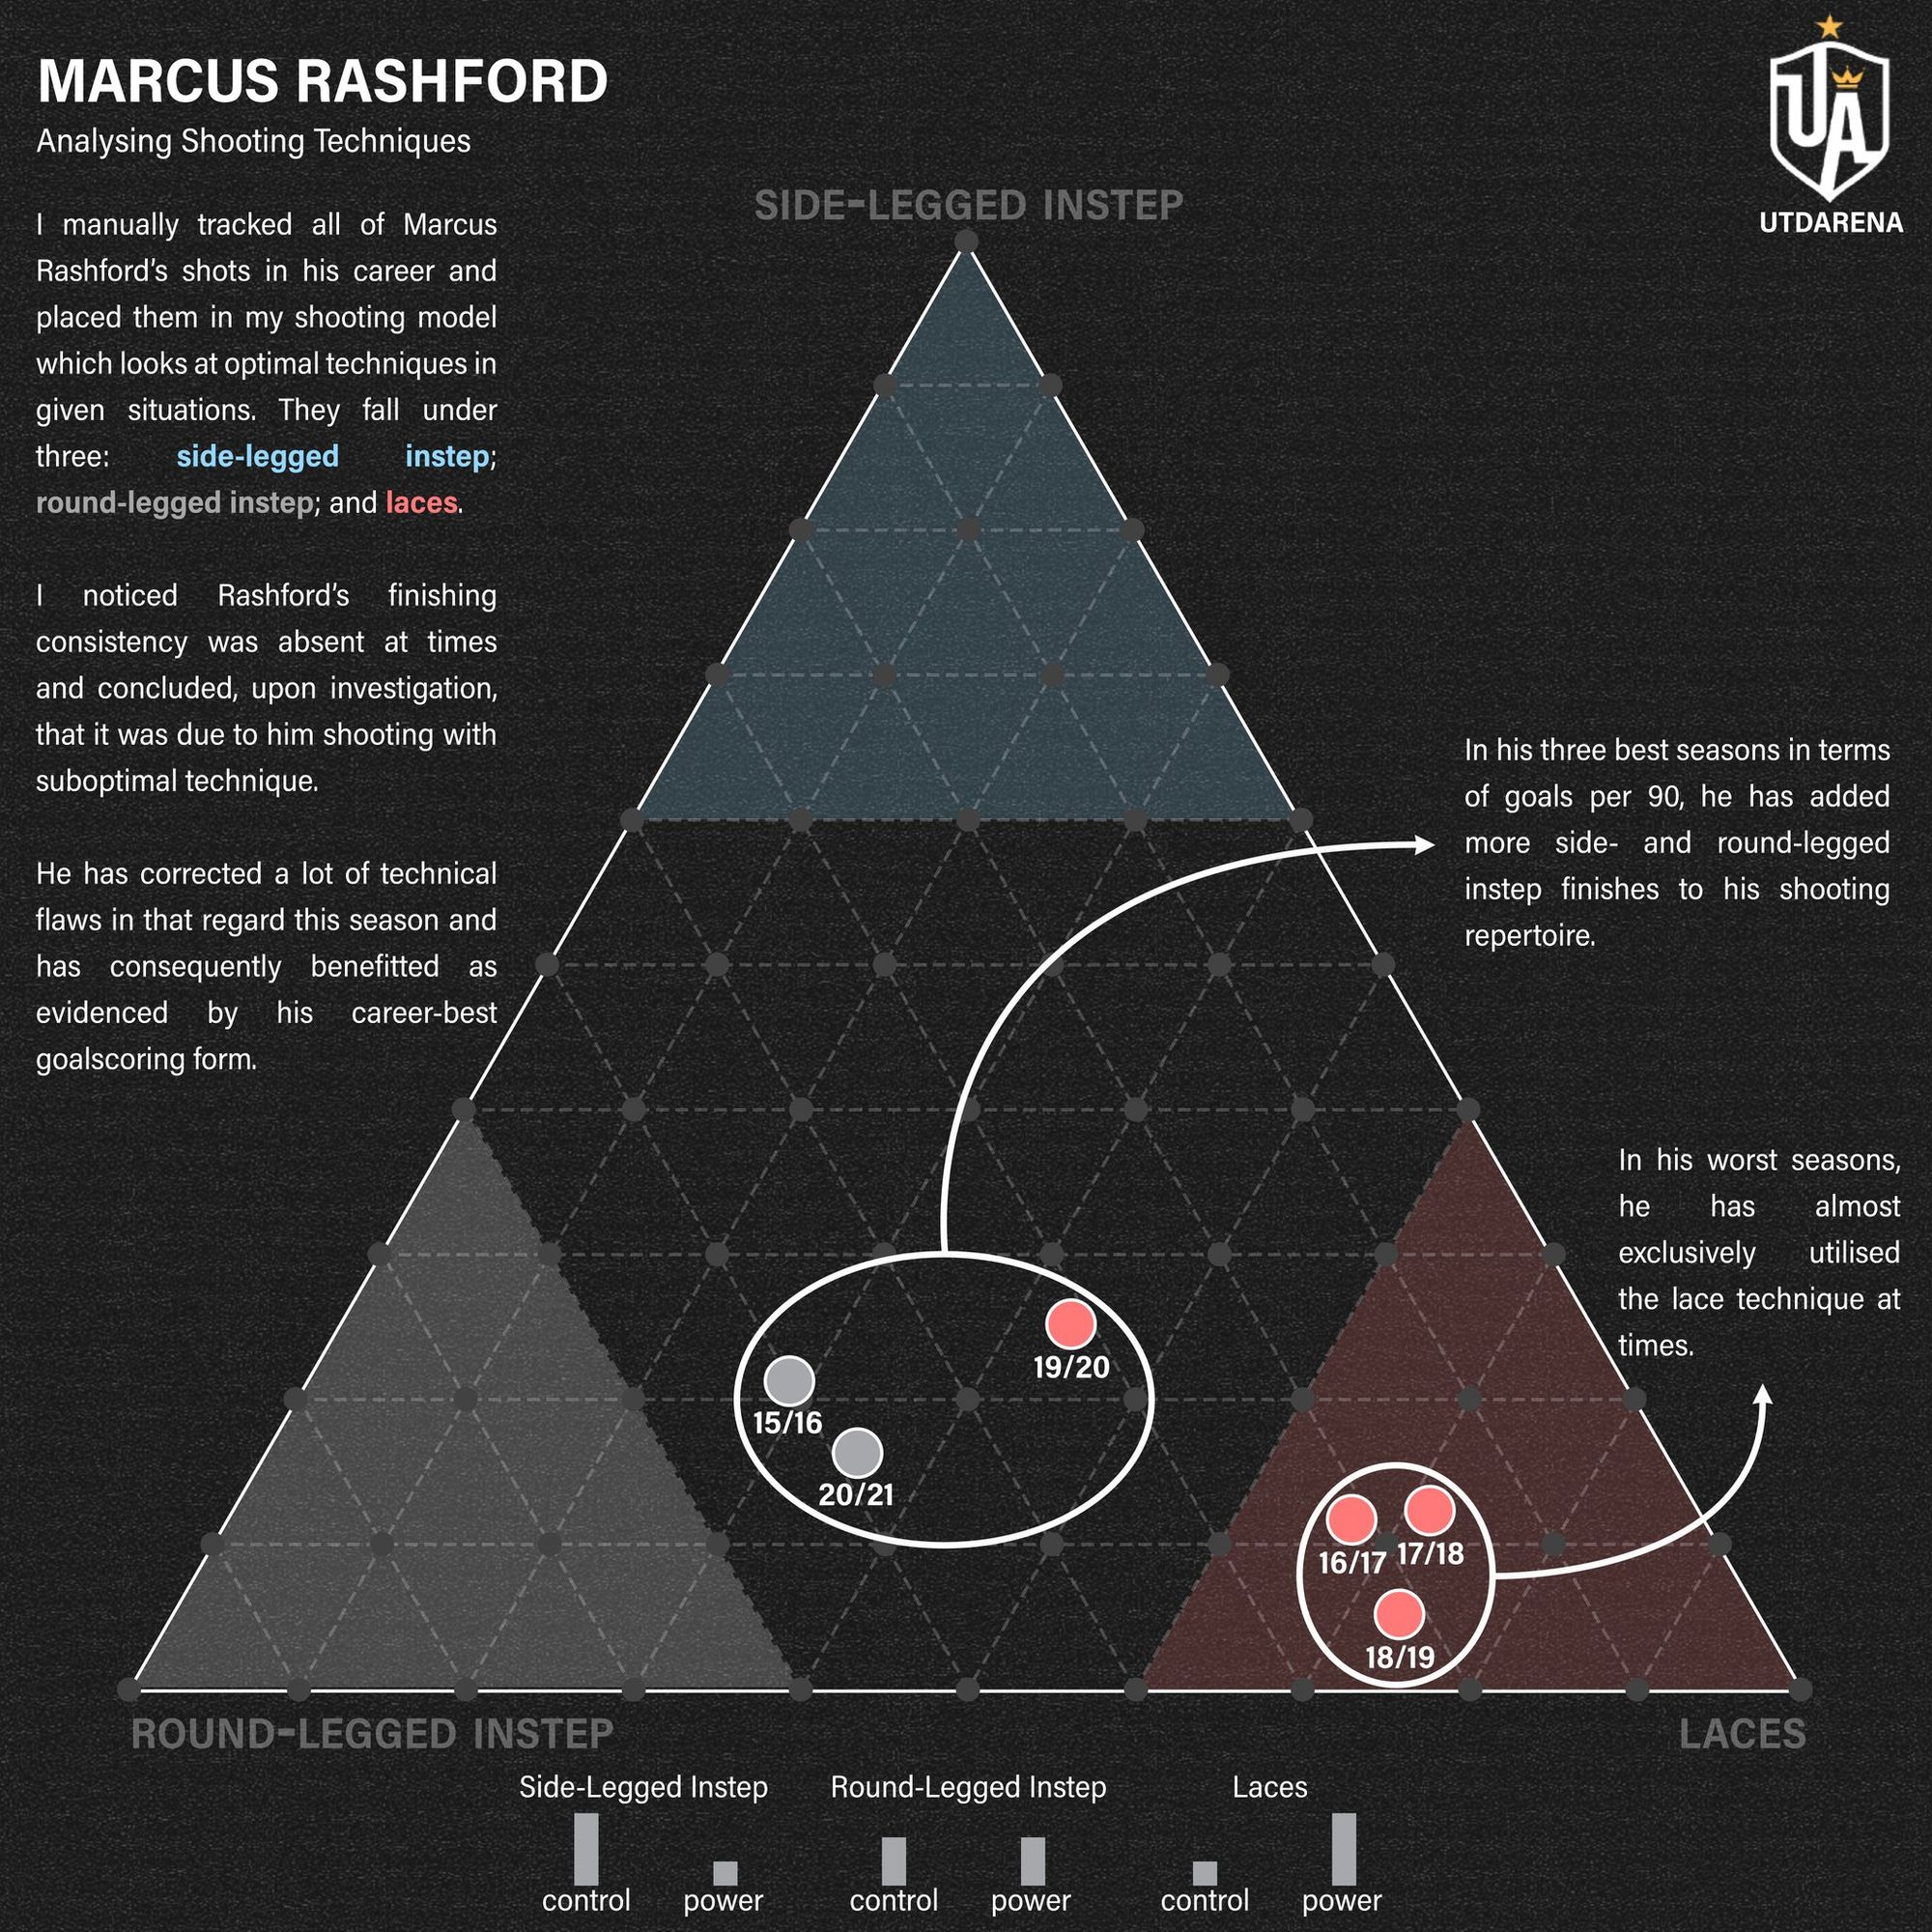
When a London-based neurocriminologist lost his job due to the pandemic, he had more free time to devote to his popular Manchester United-focused Twitter account UtdArena. He used a lot of that time to create gorgeous data vizzes, including some from data that he collected himself, manually logging in-game details he found interesting. Once, for example, he watched every single one of Marcus Rashford’s hundreds of professional shots and recorded whether they were taken with the laces, side instep, or round-legged instep—all for a single viz that showed Rashford’s best shooting seasons featured less of the high-power, low-accuracy laces technique.
“It included science (my background) and football (my hobby),” he said when I asked about his bespoke data collection. He now logs off-ball runs and other unique records for every Manchester United game and uses them to make vizzes nobody else has. It’s made him better at watching the sport, he told me. “When I started looking at [events] from a more granular perspective I noticed all the various things (body shape, communication, touches on the ball when under possession, acceleration, biomechanics, etc) that impact the game. That helped my analysis as I was able to understand better why players and teams did what they did,” he said. In 2021 he’ll start publishing more of his analysis, including video work, on a new Patreon.
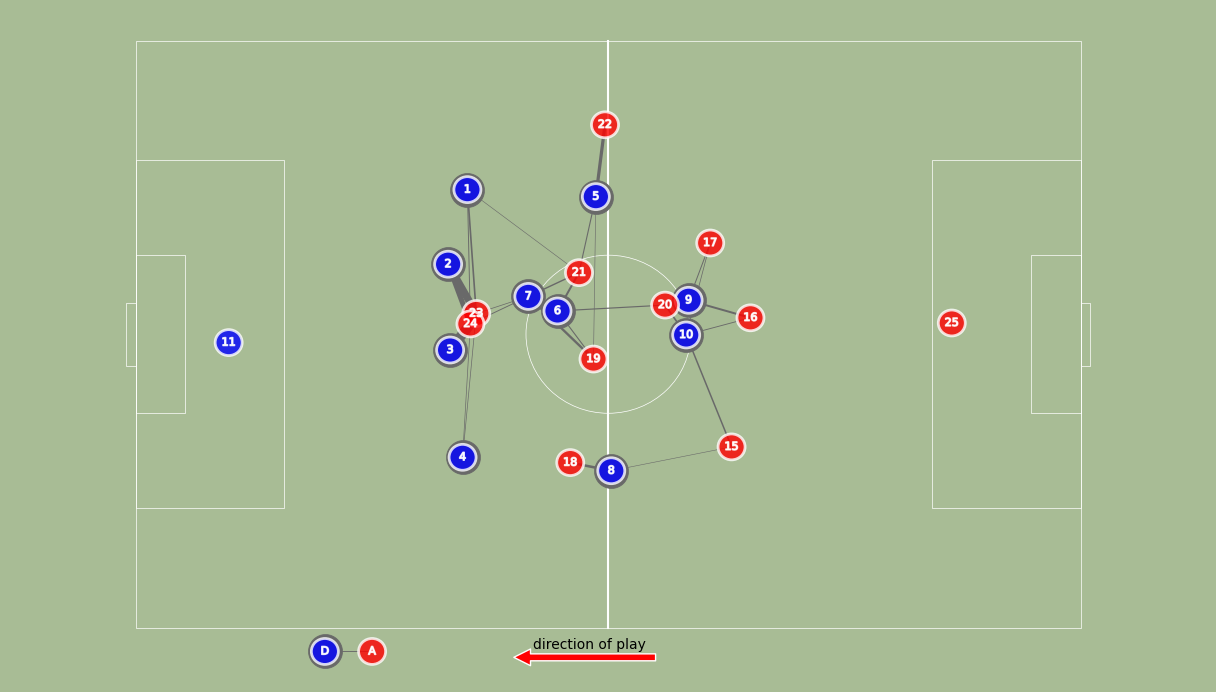
“A few years ago, after spending some time working with event data and getting tired of its limitations (always felt like the most important part of the game was missing), I started experimenting with positional data,” says Ricardo Tavares, who studied up on computer vision as a tool to gather off-ball data. He now runs the popular Last Row View account on Twitter, where he’s streamlined his data collection process enough to tweet 2D animations of interesting goals almost as soon as they happen. He also does analysis threads using Voronoi diagrams to look at pitch control, and in June introduced “marking maps” to show which defenders tracked which attackers.
But Tavares’ best contribution to soccer analysis this year has been BirdsPyView, his computer vision app that lets users tag players and generate location data. It’s a helpful step toward the kind of broadcast tracking data Decroos hopes is the near future of analytics. “Getting it perfect is really hard, but having a demonstration of how it is done is achievable,” Tavares told me. “The goal is to inspire more people to tackle that problem.”
Stay tuned to space space space in 2021 for a letter on people who are doing just that, along with other work that helps us see soccer in new and interesting ways. As always, feel free to share your favorite letters with friends and please consider becoming a paid subscriber to support the project and get two letters a week to your inbox. Happy New Year! ❧
Further reading:
Image: Italy 1990 World Cup Poster
The full archive is now free for all members.